
Machine Learning Basic_1
Introduction
Why machine learning? Many industry companies use machine learning to be specialized and differentiated by intelligent applications. For instance, early days, Amazon disrupted the retail market by introducing product recommendations to their website, Google disrupted the advertising market by targeting the new customers who have similar behaviors to the existing customers, and Uber disrupted the taxi industry by optimizing how to connect drivers with customers in real time. Such tech made their products special.
Machine Learning Pipeline
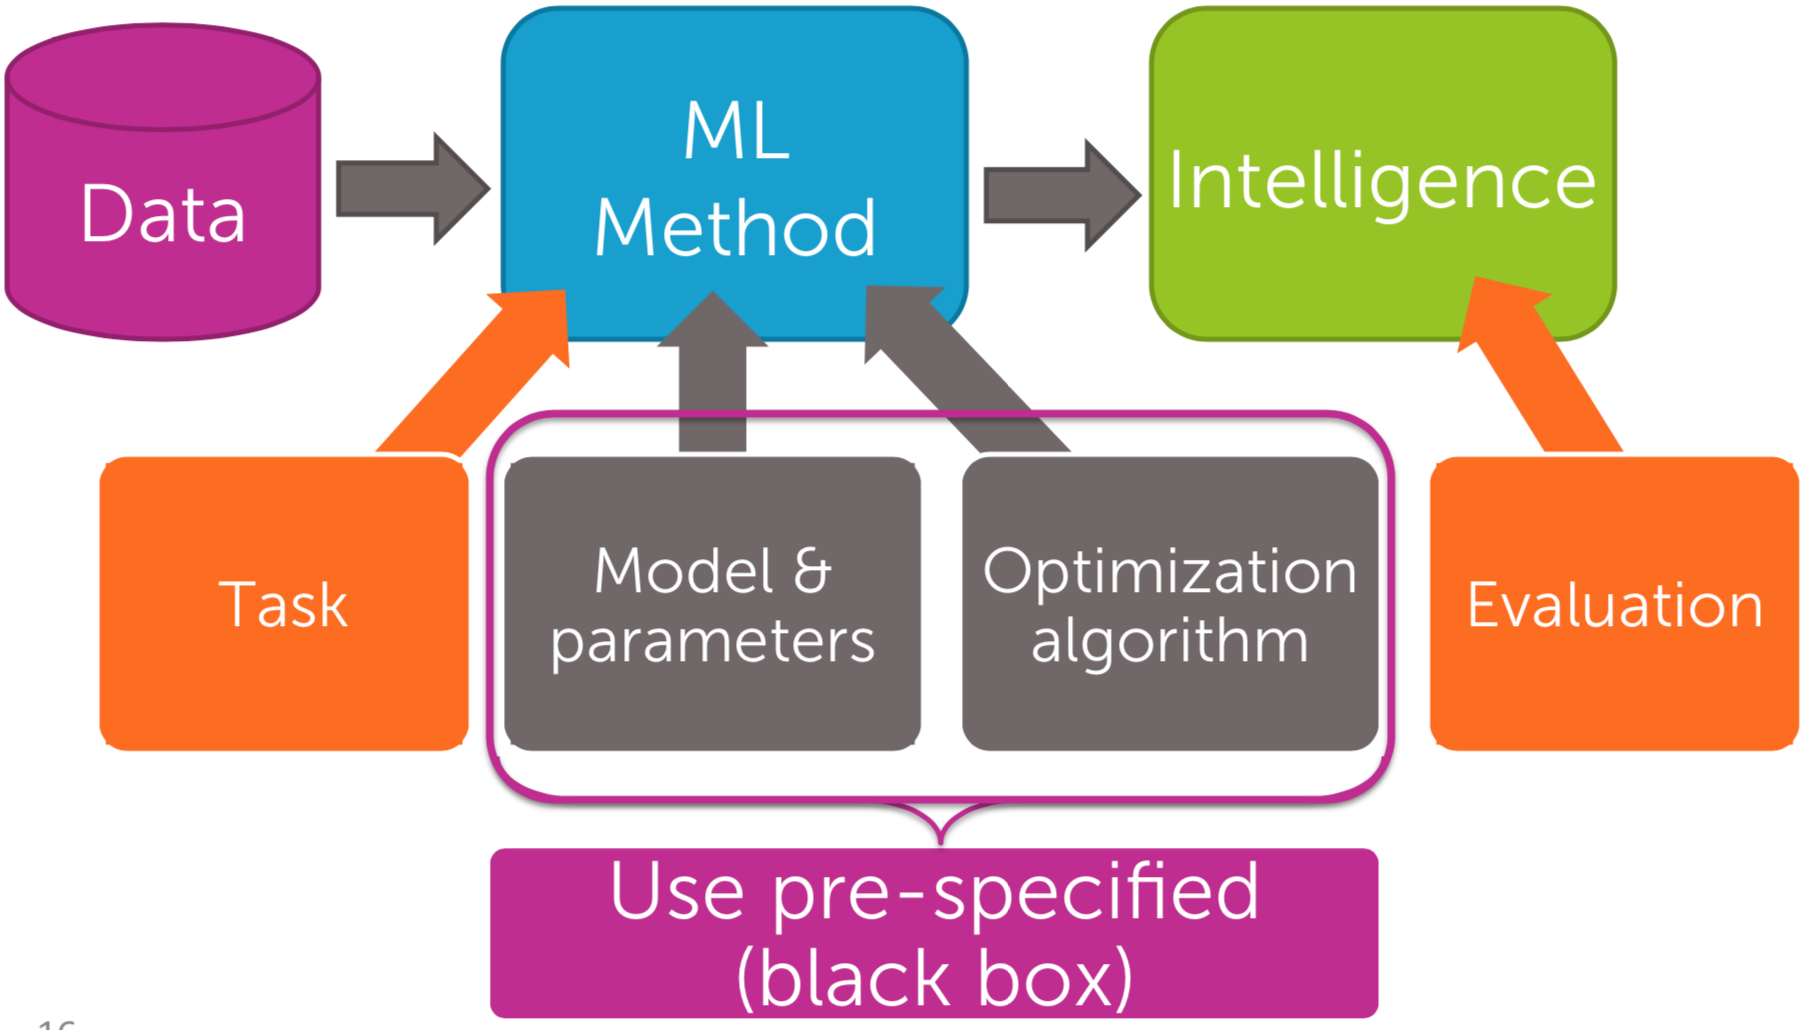
ML pipeline is simply to train a model. Machine learning pipelines iteratively improves the current model that you created for a better output. Data proliferation tremendously affect your decision-making valued or misvalued, depending on your approach and data manipulation.
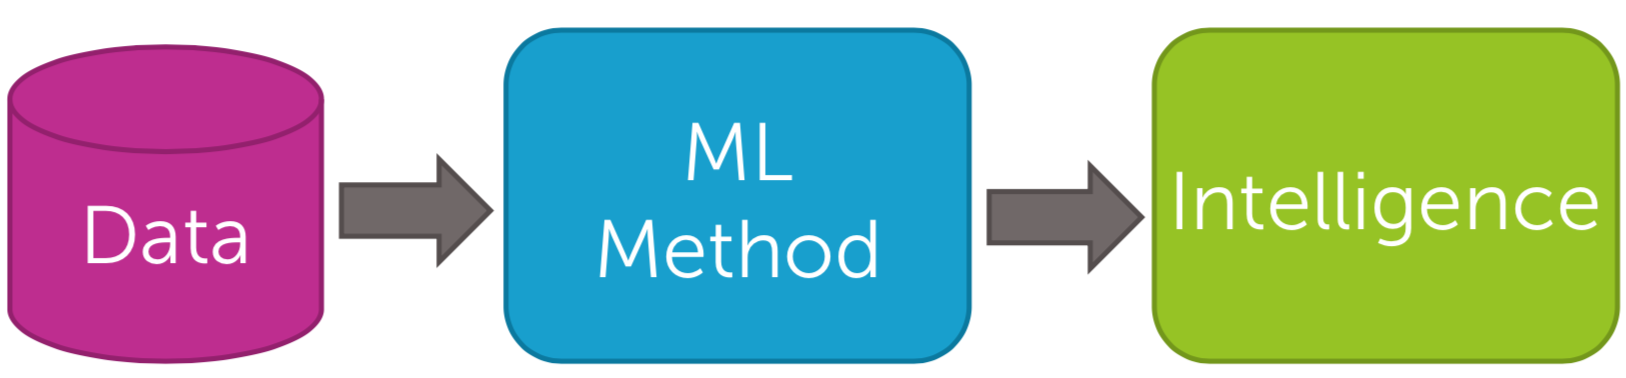
| Fig1. ML Pipeline|
Every data is not labeled: mostly unlabeled. ML method (algorithm) is based on your goal and the data type. Under the 3 categories (Supervised Learning, Unsupervised Learning, and Reinforcement Learning), the ‘method’ including learning process varies. The following figure and table may clearly show what they are and when to use.
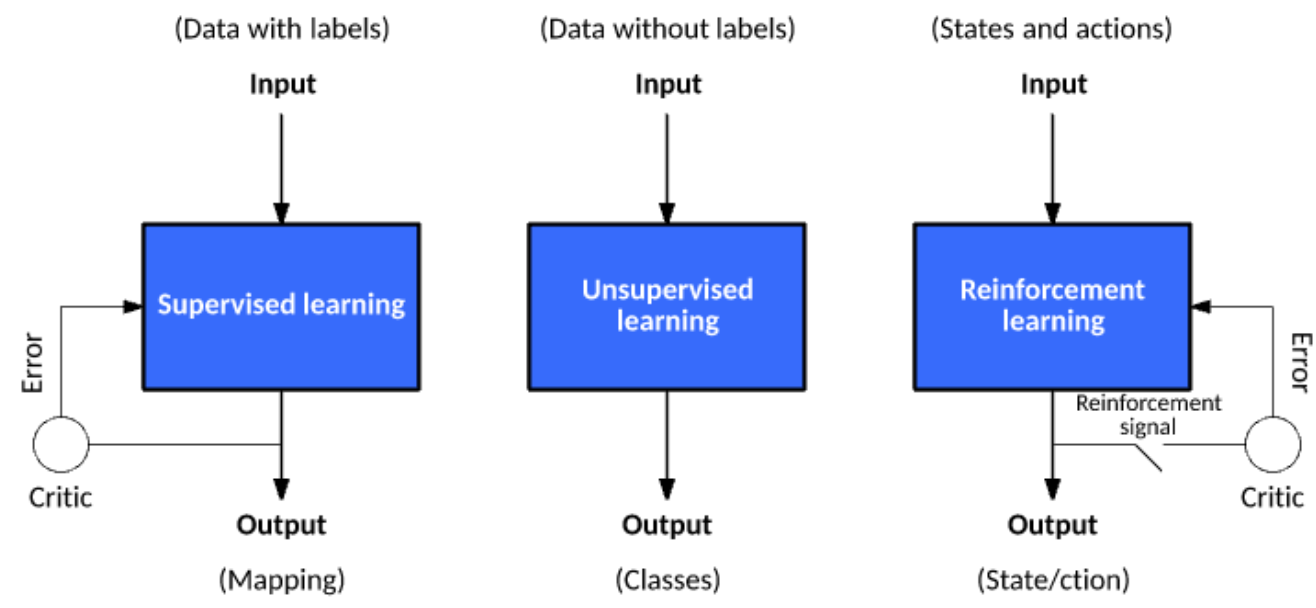
| Fig2. ML Type|
| Type | Supervised | Unsupervised | Reinforcement | |||||
|---|---|---|---|---|---|---|---|---|
| Input | Data with Label | Data without Label | states and actions | |||||
| Problem Type | Regression, | Clustering, | Exploitation, | |||||
| Classification | Association | Exploration | ||||||
| Algorithm | Linear Regress., | K-Means, C-Means, | Q-Learning, SARSA, | |||||
| Logistic Regress., | Apriori, DBSCAN, GAN, | Monte Carlo, TD, etc. | ||||||
| SVM, KNN, etc. | Autoencoder, etc. | |||||||
| Goal | Predict outcomes | Discover underlying | Learn a series of | patterns | actions | |||
| Application | Risk Evaluation, | Recommender, | Self Driving Cars, | |||||
| Forecast Sales, .. | Anomaly Detector, .. | Gaming, Healthcare,.. |
| Table1. ML Type|
For a better learning process and delivery, ML pipeline should have the following processes:
- Data collection
- Data cleaning (Data Wrangling)
- Feature extraction / Feature selection
- Model evaluation (Evaluation Metrics)
- Visualization
If you are interested in more details, Check here.
Terminology
Labels
A label is the real value that we’re predicting - \(y\) variable (dependent variable). For example, a label could be a real housing price, a real species animal in a picture, an actual meaning of an audio clip, etc.
Features
A feature is an input variable - \(x\) variable (independent variable). A simple ML problem could have a single feature; it depends on how we define a problem. Suppose that housing price replies on only size. Then, we have one independent variable (house size) that affects one dependent variable (housing price).
NOTE: if a problem is set up more complicated having \(N\) features, then the features can be expressed as \(x_1, x_2, x_3, ..., x_N\).
More real example can be a spam detector. Then, features are:
- \(x_1\): words in the email text
- \(x_2\): sender’s email address
- \(x_3\): time that the email was sent
- \(x_4\): the particular phrases that a spam usually has
Examples
An example is a particular instance of data, \(\overrightarrow{x}\) (boldface indicate a vector). A labeled example has both feature(s) and the label.
labeled examples: {features, label}: (x, y)
The following table shows 5 labeled examples from a housing price data set.
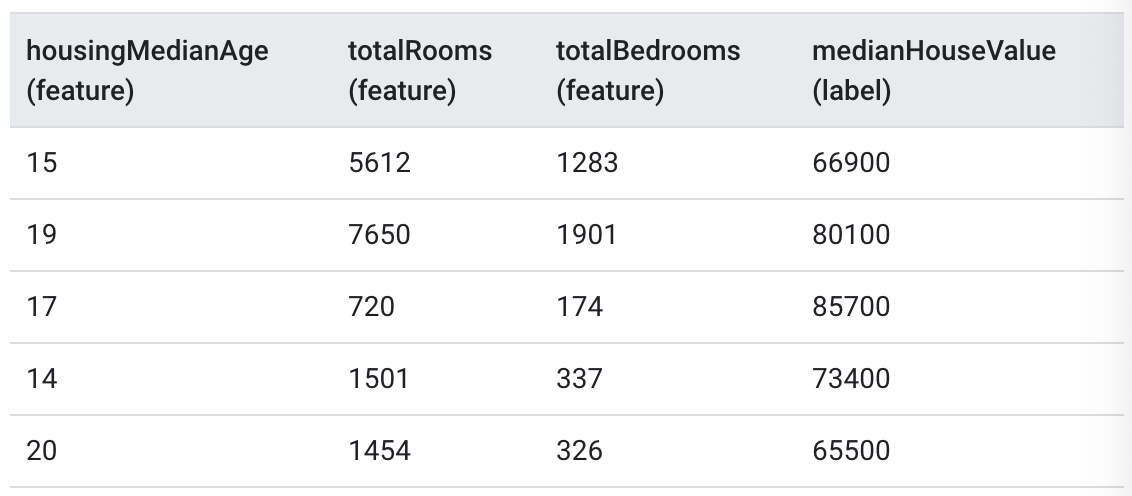
| Table2. Labeled example|
unlabeled examples: {features, ?}: (x, ?)
There are 3 unlabeled examples from the same housing price data set, which do not have a label (medianHouseValue).
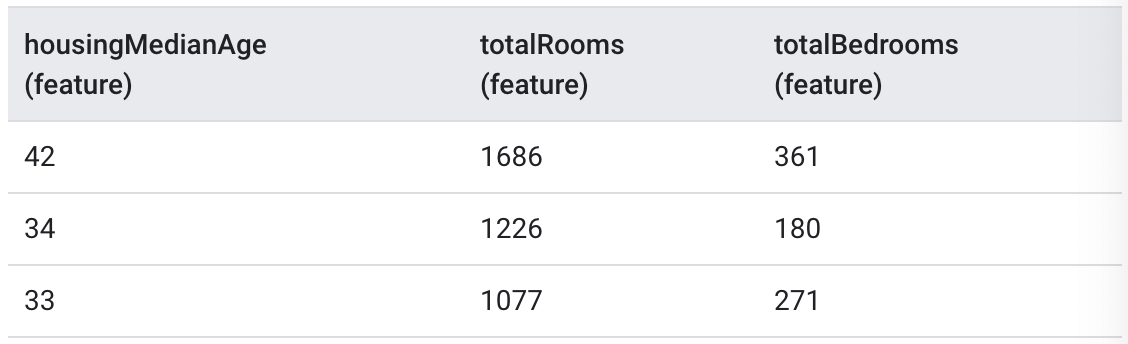
| Table2. Unlabeled example|
Once trained our model with labeled examples, we use that model to predict the label on unlabeled examples. Similarly, in the spam detector, unlabeled examples are new upcoming emails which don’t have labels.
Models
A model defines the relationship between features and label. You feed labeled examples to the model and enable the model to learn the relationships between features and label. That learning process is called ‘training’.
Inference means applying the trained model to unlabeled examples. That is, you let the trained model predicts estimated value (\(\hat y\)) from training. During inference, in the spam filter example, your model can predict which are spam emails among newly upcoming emails. Similarly, in housing price estimator, your model can predict medianHouseValue for new unlabeled examples.
Applications
Let’s see what applications are in each category.
Supervised learning (SL)
SL mainly has two categories: regression and classification.
- Regression
A regression model predicts continuous values like housing price. The following example model learns the relationship from the house level features to the observed sales price in order to predict the price of a new house. Both simple regressor and multiple regressor have linear or non-linear regression.
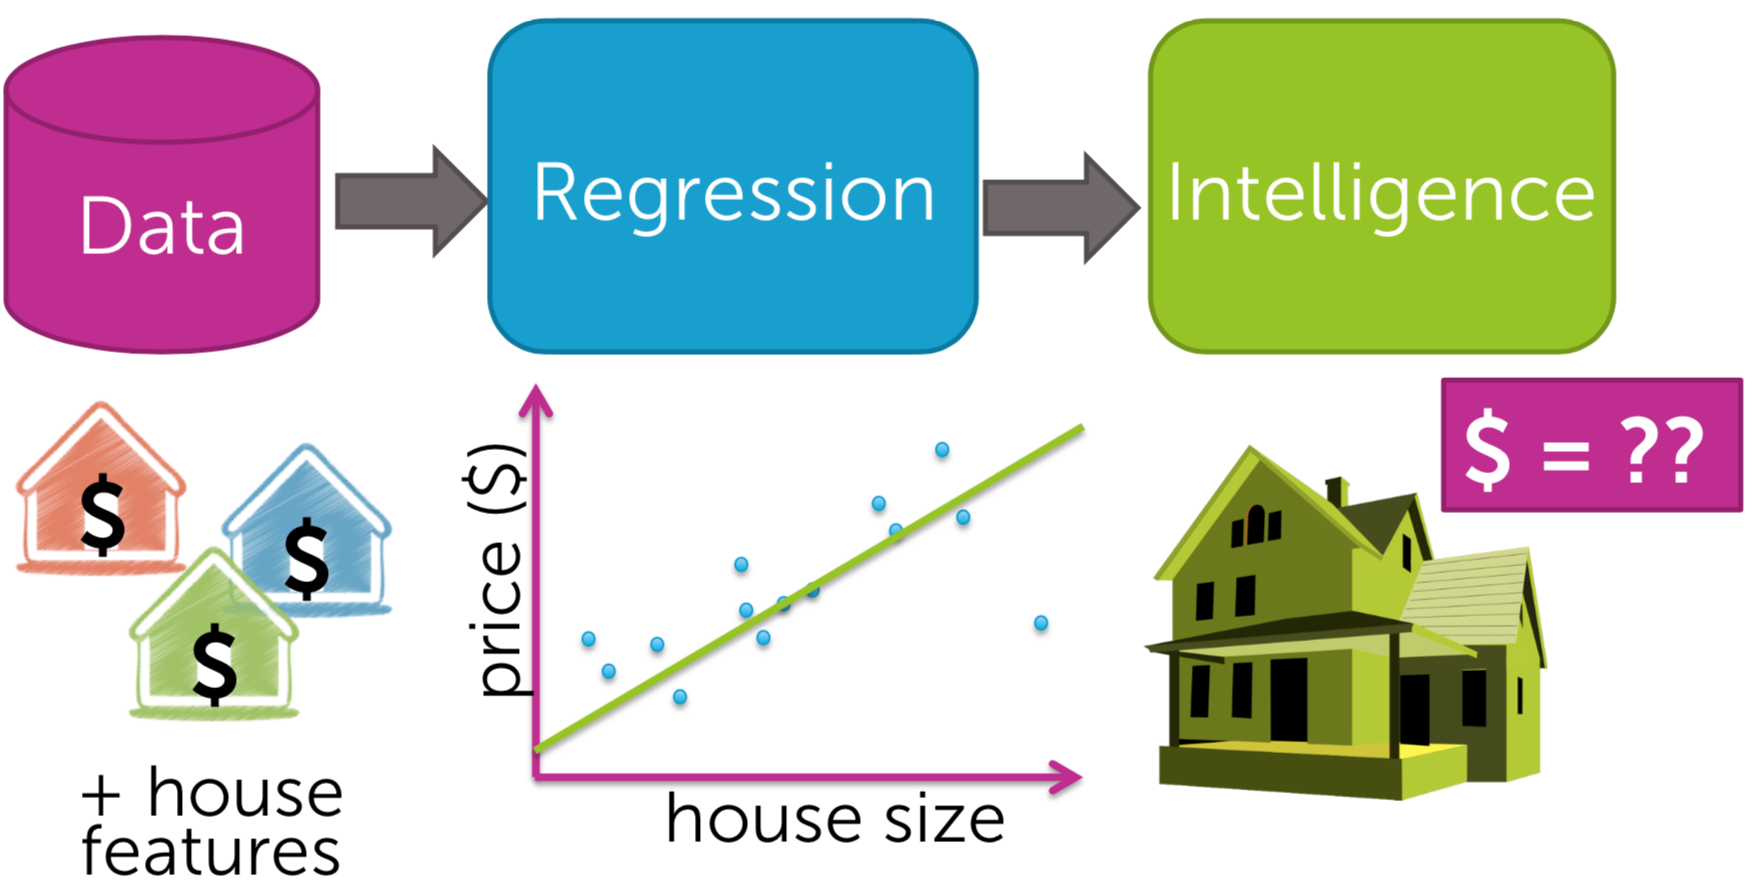
| Fig3. Linear Regression|
- Classification
A classification model predicts discrete values like spam or not, dog or cat, etc. The following classification example is a sentiment analysis task. From the reviews of the customers who visited a restaurant, features are extracted for the input of a ML algorithm. The model learns it with labeled examples to classify a new unlabeled review is positive or negative.
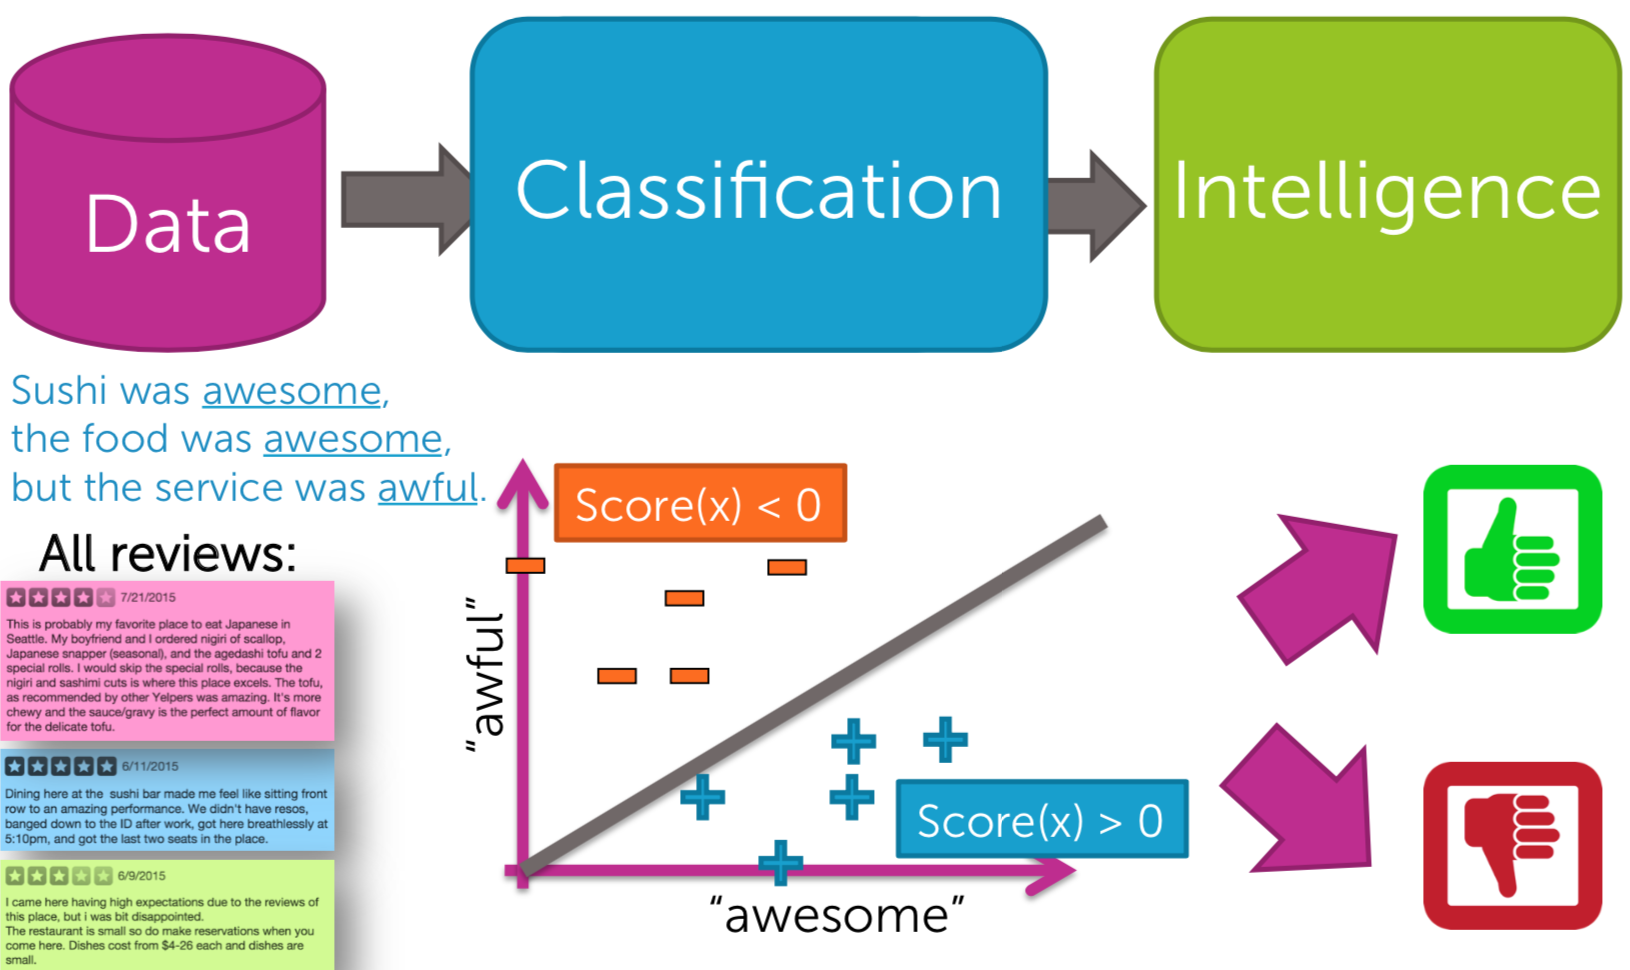
| Fig4. Classification|
Unsupervised Learning (UL)
Let me briefly introduce one UL example of application; clustering.
- Clustering
A
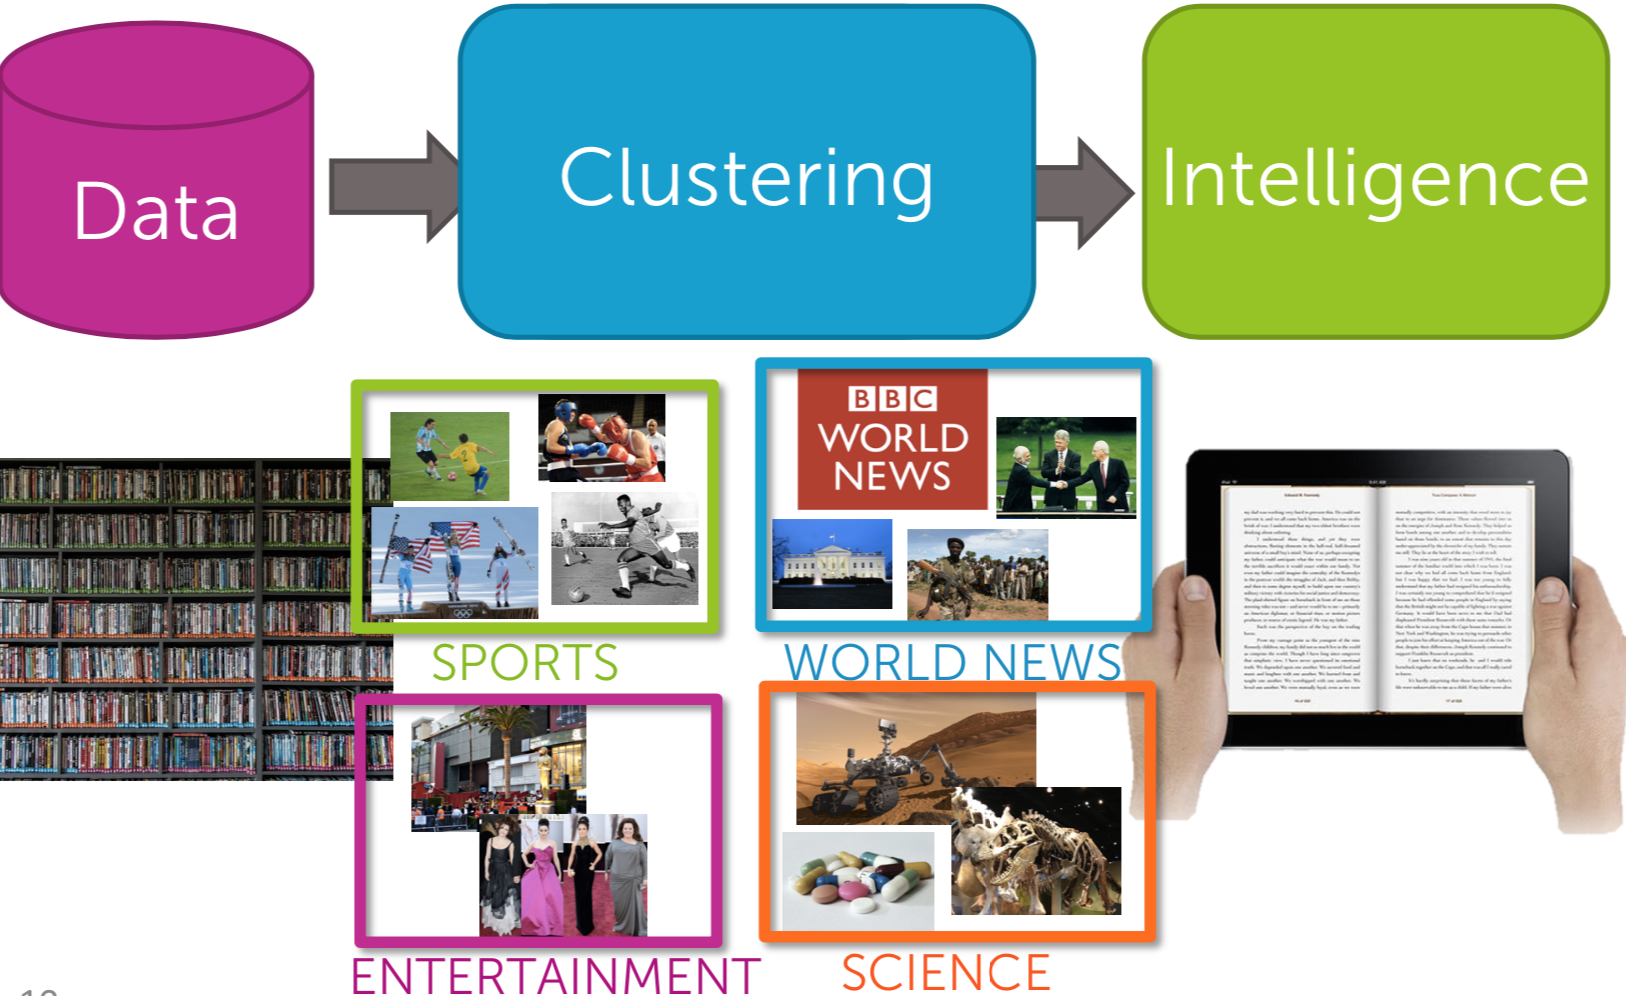
| Fig5. Clustering|
Semi-Supervised Learning
Although a recommendation system can use SL or UL, it is neither of them (in my view) because it uses both algorithms as ‘tools’. When classifying items into recommended or not, labeling (classification) is needed. When understanding customers’(users’) behaviors on an item, it uses UL (content-based, collaborative filtering, or both). The ML method can be based on a user-item matrix or a matrix factorization.
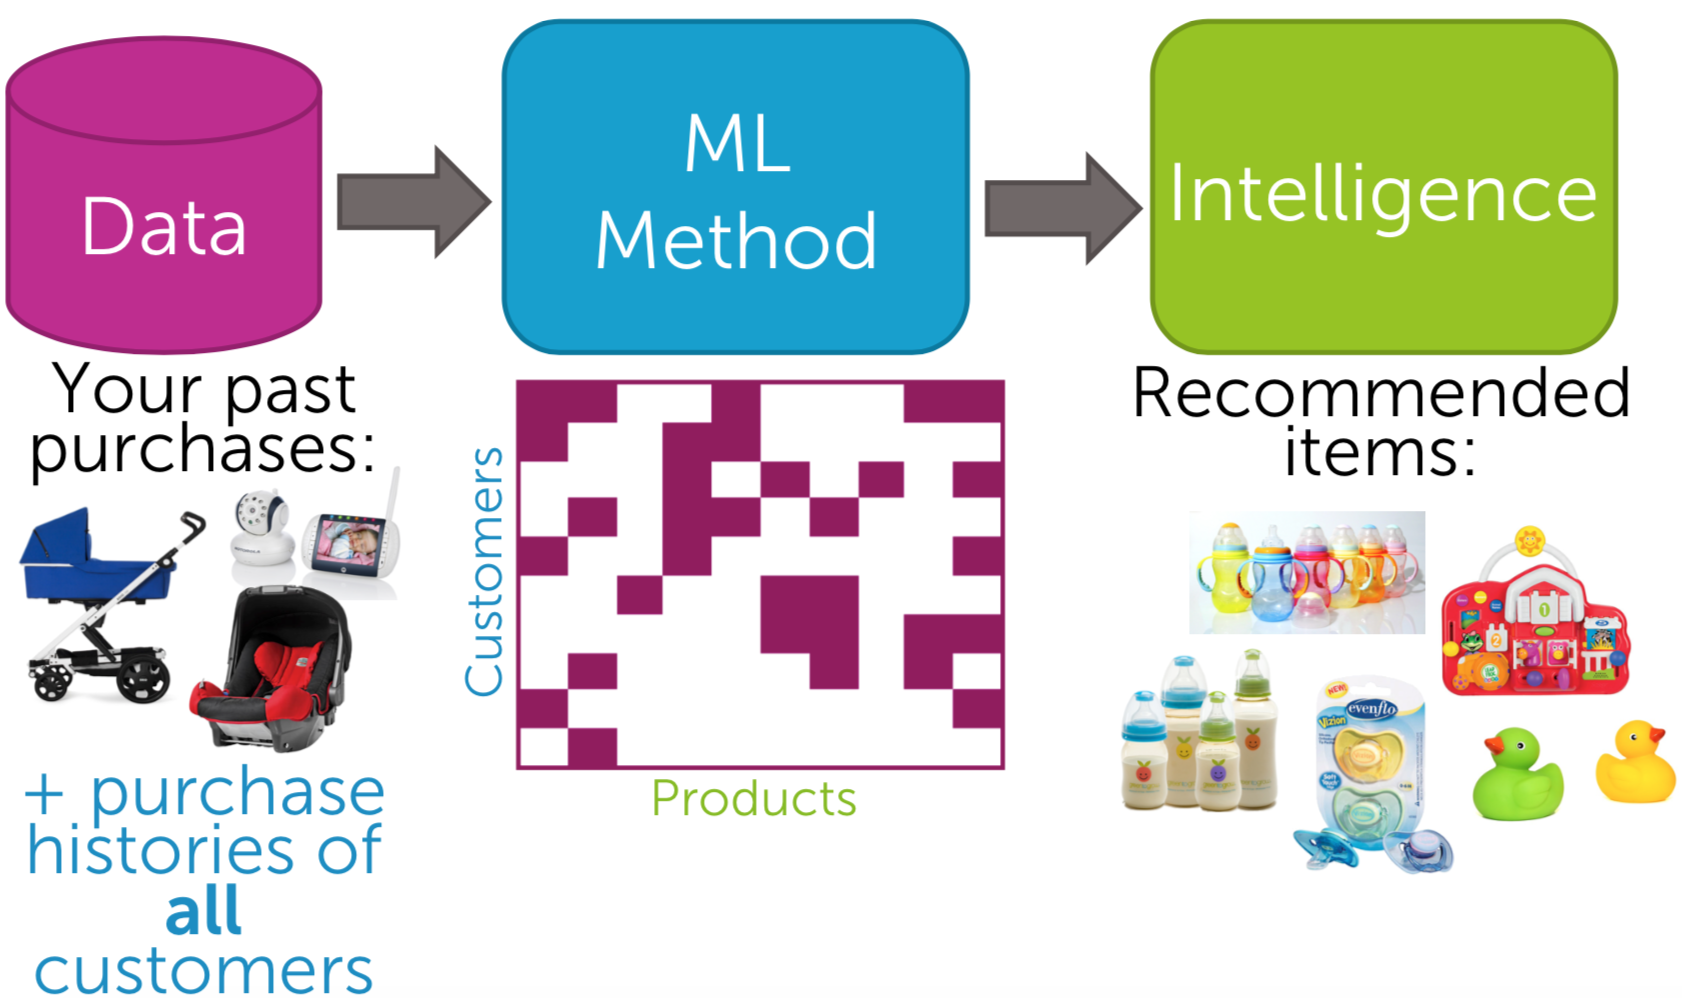
| Fig6. Recommender|
NOTE: Content-based filtering is based on more item profile. In a movie recommender example, item profile can be such as genre, year, director, actor, etc. (e.g. images/videos recommender: metadata and tag, people recommender: a set of friends). The simple idea of it is that you analyze some features from the items that your users (customers) like and recommend some other items that have same features (How similar features between items). On the other hand, collaborative filtering is to analyze interaction between users and items. From your purchase history, you are grouped with those who had the similar purchase behavior. Then, the items that the squad bought but you didn’t are recommended. Content-based filtering usually use TF-IDF (a way of clustering by vectorizing each item) while collaborative filtering can use user-item matrix (memory-based method) or matrix factorization (model-based) is needed to extract features.
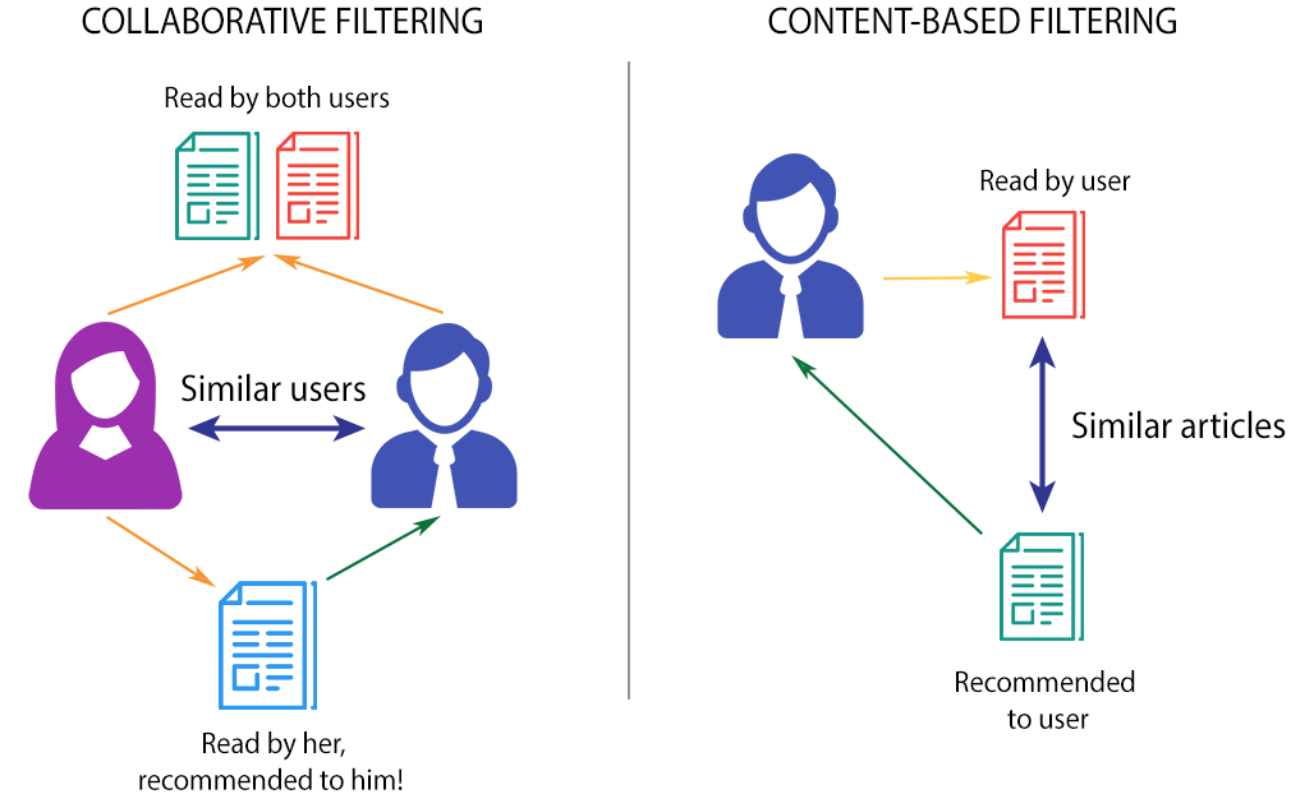
| Fig7. CF vs. CBF|
Deep Learning (DL)
What if input data are images (pixels), but texts for a recommender system? Visual recommender system uses DL to extract the features of the images that the users bought and recommend the similar styles (features) of items.
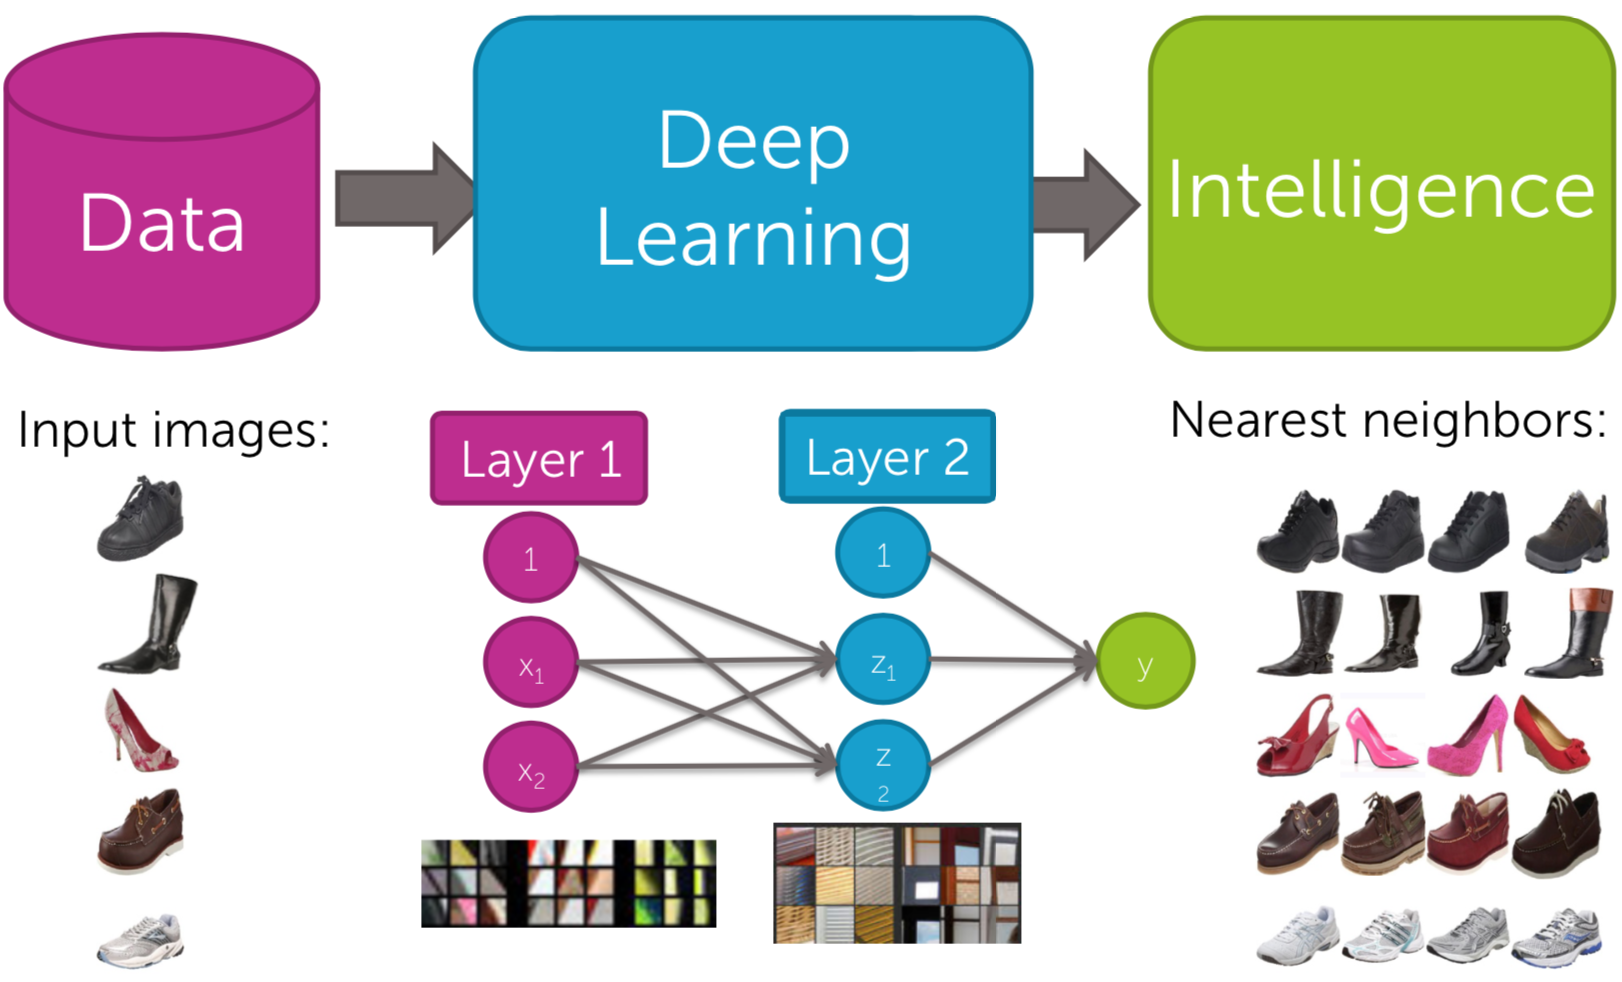
| Fig8. DL|
Overview
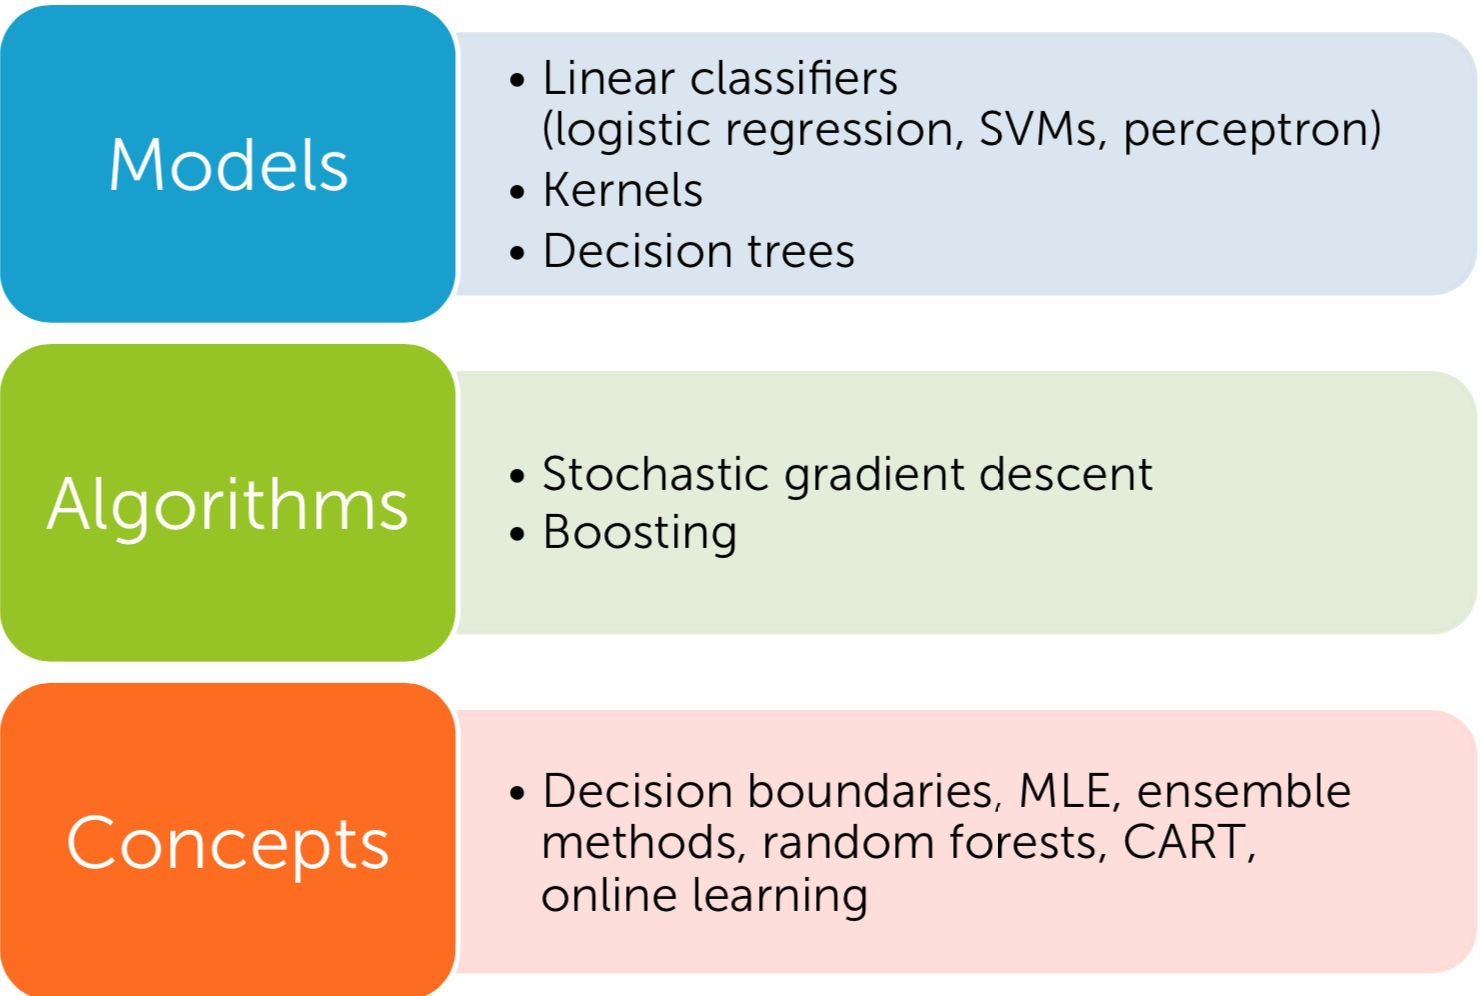
| Fig9. Overview|
| Fig10. lr_|
| Fig11. class_|
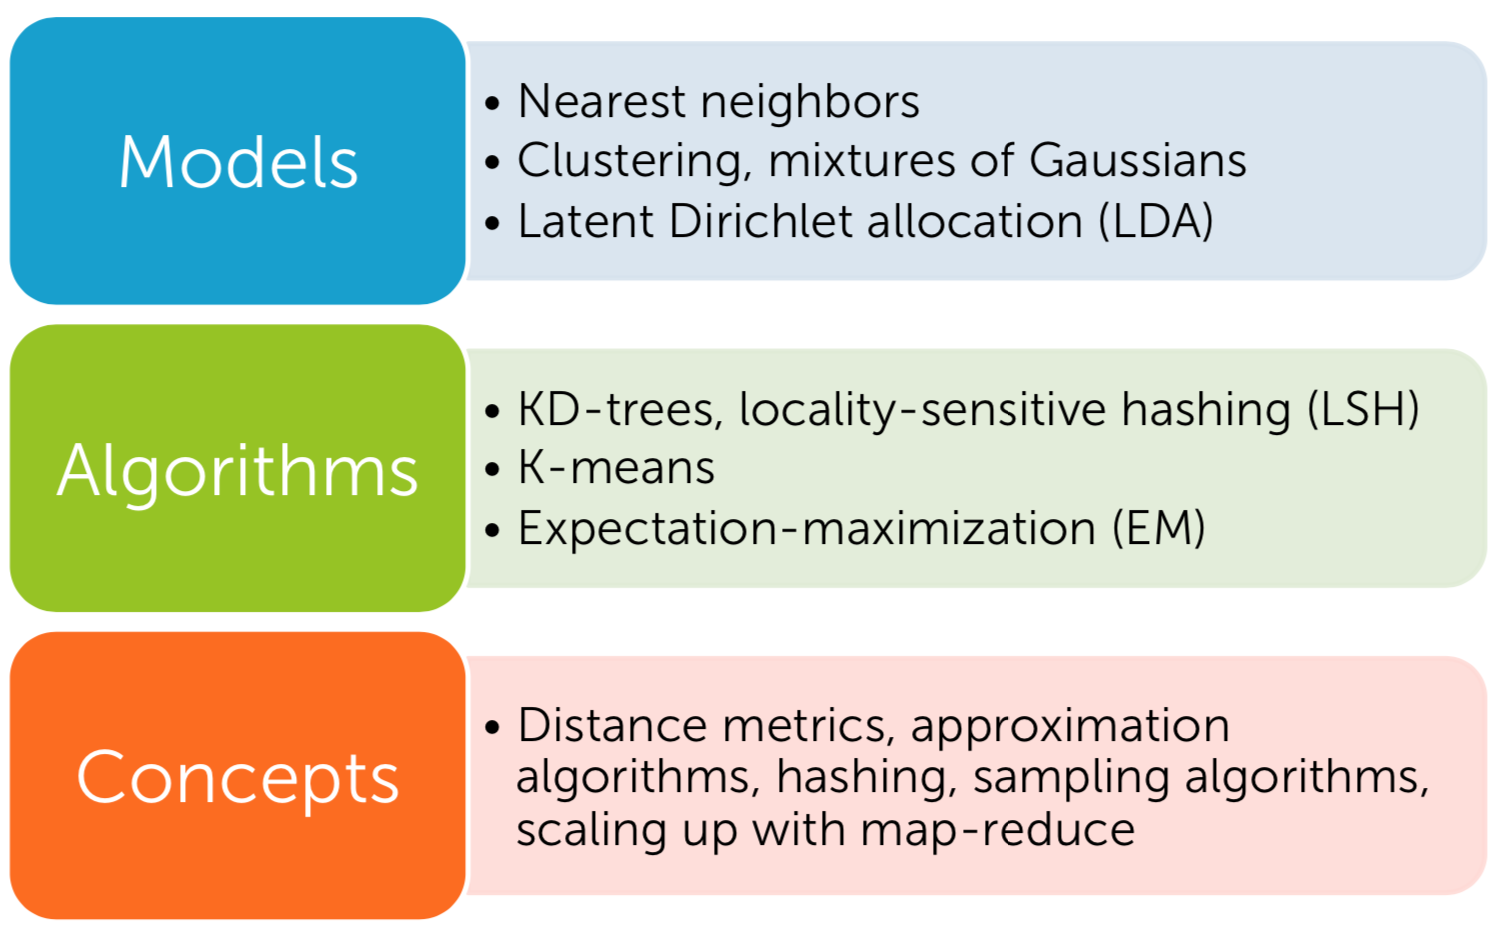
| Fig12. cluster_retrieval|
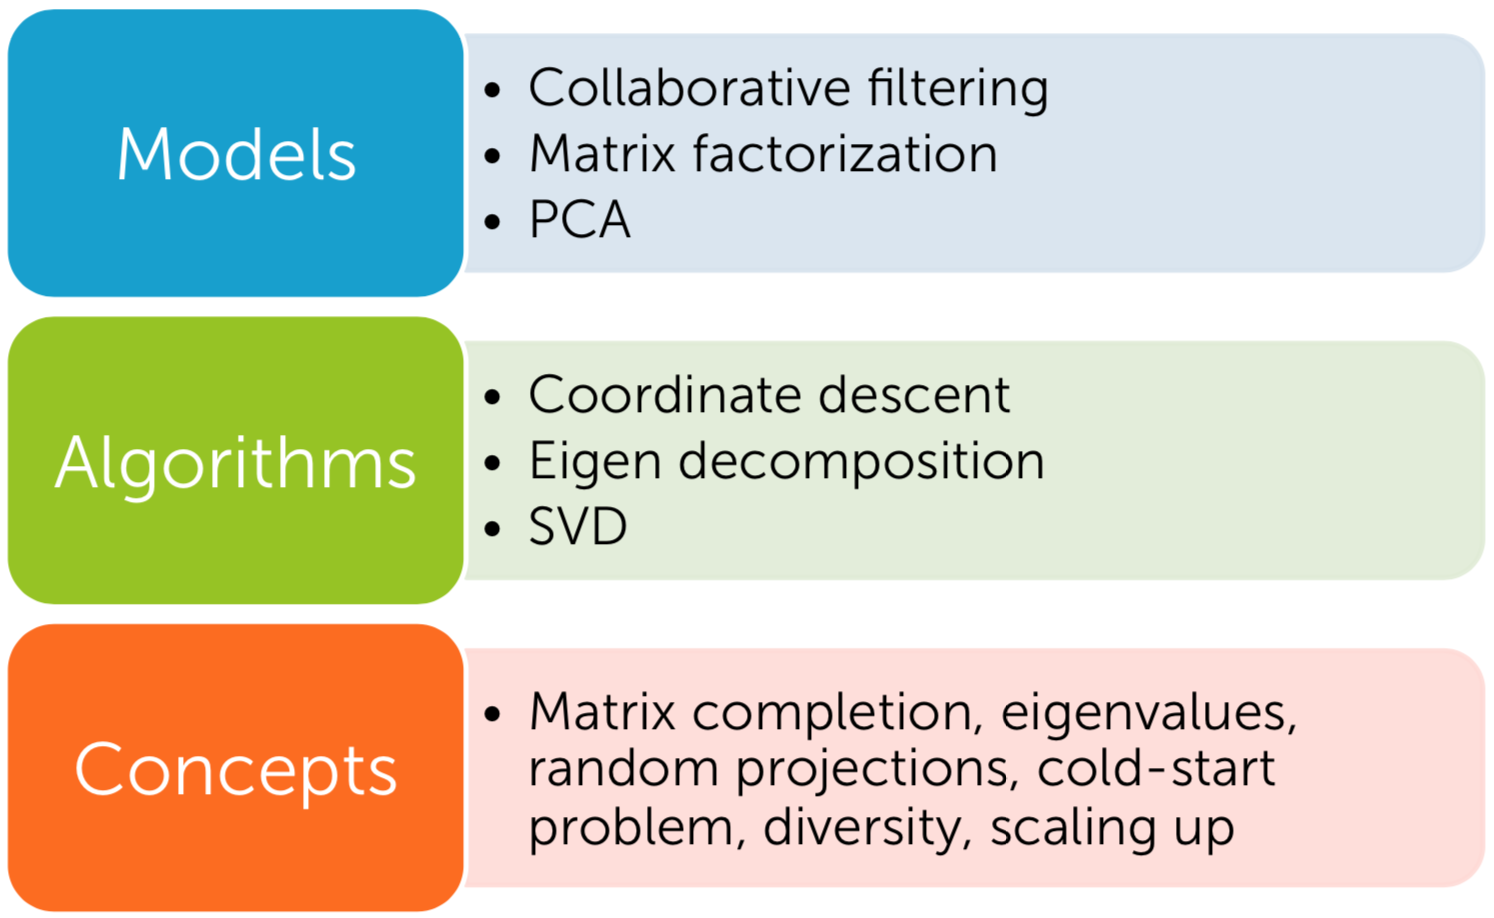
| Fig13. mf_dr|
Leave a comment